Finding a Confidence Interval for Lift
Posted on Sun 05 June 2016 in Blog
This blog post has been cross-posted from here to Magnetic's tech blog.
Note: this post doesn't describe original mathematical research on my part. My initial motivation to write this post was simply that I was surprised by how hard it was to find a formula for the confidence interval of lift via Google, and decided that I needed to make it easier for the next person who googles "confidence interval for lift" or something along those lines.
What is lift?
Imagine that we work at an advertising technology company called Magnetic. We have two ideas for strategies we will use to decide which internet users see which ads: strategy A and strategy B. We already suspect that strategy B is better, and therefore want to know how much better it is.
We use strategy A to show ads to 20,000 people, 400 of whom buy the product we are showing to them (that purchase is called a conversion in our industry). Strategy B is used on 1,000 people, 30 of whom buy the product. So strategy A has a 2% conversion rate, while strategy B's conversion rate is 3%. How much better is strategy B?
Note: these conversion rates are huge by industry standards. It's a toy example.
We could subtract the conversion rates: 3% - 2% = 1%. But while a change of 1% is a big jump starting from 2%, it would be a tiny change if the conversion rates were 91% and 90%. If we divide the conversion rates, however, we get lift. 3% / 2% = 1.5. So strategy B's conversion rate is 1.5x better.
Oftentimes you'll see lift presented as a percentage centered at 0 (so 0% lift would mean no change). If lift = 100 * ((conv_rate_B / conv_rate_A )- 1), we get 50%. In this blog post I'll mostly use latter way of computing lift, but please remember that 1.5x lift and 50% lift are the same thing.
One more caveat - there are two ways to conceive of lift. You could either talk about lift as the quotient when comparing two separate rates (like we are here), or the rate of a subset of a population compared to the rate of the larger population. A bit more formally, the former is P(event | condition B) / P(event | condition A) where conditions A and B never occur together, while the latter is P(event | condition B) / P(event). In this blog post we'll solely talk about the former, P(event | condition B) / P(event | condition A) - but please don't be confused if you hear other people discuss the alternative version of lift.
Why do we care about confidence intervals?
For those of you who are not statisticians and therefore don't already trust me that you should care about confidence intervals, I owe you an explanation.
Let's continue with our example from above: strategy A is shown to 20,000 people and results in 400 conversions, while strategy B is shown to 1,000 people for 30 conversions. We have relatively small sample sizes by the standard of online advertising. 50% lift sounds very impressive, but that's based on only 430 conversions. We expect that if we ran this experiment again on the same number of people those numbers would not be the same - so can we actually conclude that strategy B is the way to go? If we gave both strategies 100x more users to show ads to, would strategy B still get us a 50% higher conversion rate?
Statisticians (or to be more specific, Frequentists) like to imagine that the gods have endowed both strategies A and B with 'true' conversion rates that are generating this data, and that there therefore exists in the heavens a true lift for strategy B with regards to strategy A. A confidence interval would tell us that, given our preference for how confident we'd like to be (let's say 95% just for fun), the confidence interval will contain the true lift with 95% probability. Bayesians prefer to use a related concept called the credible interval, but that's beyond the scope of this blog post.
More practically, when a product manager asks my team "Is strategy B better than strategy A?", we want to answer either "it's better", "it's worse", or "given the sample size we don't know". If the confidence interval on lift includes 0, that would imply we don't have enough data to know whether B is better than A. If the confidence interval lies entirely on the "better" or "worse" sides, we can give them a more interesting answer
Whew. Now you understand why we want a confidence interval for lift. How do we get it?
Computing confidence intervals via simulation
Let's start with a simulation-based method. They're far more fun and intuitive than formulas, and once we have a formula we can check it against the results we get from simulations. As an aside - I recently watched Jake Vanderplas's talk at PyCon 2016, Statistics for Hackers, which I highly recommend watching. To the extent that I've ever had a philosophy behind statistical tests, he shares it and explains it.
Lift is a ratio of two ratios. We already know how ratios of successful attempts to total attempts are distributed - that's the Beta distribution. David Robinson has an excellent post explaining its interpretation and usefulness, so I'll refrain from elaborating on that. To simulate the distribution of lift we just need to simulate pairs of beta distributions, and take their quotient. Please ignore the fact that in this blog post I'm switching back and forth between Frequentist and Bayesian approaches.
import numpy as np

def lift_simulations(Na, Pa, Nb, Pb, Nsim=10**4, prior=(1, 1)):
    """
    Na is the total events for strategy A,
    Pa is positive events (conversions) for A,
    etc.
    The prior matters most at small sample sizes
    """
    # The parameters of the beta distribution are:
    #   alpha = number of successes
    #   beta = number of failures
    # add 1 to both alpha and beta for a uniform prior
    cvr_b = np.random.beta(prior[0] + Pb, prior[1] + Nb - Pb, size=Nsim)
    cvr_a = np.random.beta(prior[0] + Pa, prior[1] + Na - Pa, size=Nsim)
    return (cvr_b / cvr_a) - 1.0
Now we have a function that will give us as many simulated data points as we want. What about a confidence interval? We have an array of simulated data points, so we just need to use the percentile function to find the bounds of our confidence interval.
def sim_conf_int(Na, Pa, Nb, Pb, interval, Nsim=10**4, CI=0.95):
    simulations = lift_simulations(Na, Pa, Nb, Pb, Nsim=Nsim)
    # return a tuple of (lower_limit, upper_limit)
    if interval == "upper":
        return (np.percentile(simulations, 100 * (1 - CI)), float("inf"))
    if interval == "lower":
        return (-1.0, np.percentile(simulations, 100 * CI))
    if interval == "two-sided":
        return np.percentile(simulations, (100 * (1 - CI)/2, 100*(1 - (1 - CI)/2)))

    raise ValueError("interval must be either 'upper', 'lower', or 'two-sided'")
To interpret the upper/lower/two-sided intervals:
| Type | Interpretation |
|---|---|
| Upper | We are 95% certain the true value is between _ and infinity. |
| Lower | We are 95% certain the true value is between -1 and _. |
| Two-Sided | We are 95% certain the true value is between _ and _. |
For symmetry, all three are returned as pairs of numbers. The lower C.I. bottoms out at -1 instead of -infinity because the lowest possible value for lift is -1.
Computing confidence intervals without simulation
The above method works well empirically. But instead of generating tens of thousands of random numbers every time we want a confidence interval, we would prefer a simple formula. In my research I found a few candidates, but only one seemed to fit the answers given by the simulated confidence intervals.
I eventually found the correct answer in a paper written at Stanford and Yahoo Labs. They reference the formula briefly, and cite a textbook by Altman, Machin, Bryant, and Gardner. Due to our collective lack of creativity we have taken to calling this method the "Altman interval".
The basic idea is that log(1 + lift) (where lift is what we previously defined as ratio1 / ratio2 - 1) is approximately normally distributed. See the code below for details:
import math
from scipy.stats import norm
def altman_interval(Na, Pa, Nb, Pb, CI=0.95, interval="two-sided", e=0.5):
    #lift of B over A
    if interval not in ("two-sided", "upper", "lower"):
        raise ValueError("Interval must be either 'two-sided', 'upper', or 'lower'.")
    #add e to each number to keep weird stuff from happening when Pa or Pb are close to 0
    Na += e
    Pa += e
    Nb += e
    Pb += e
    log_lift_mean = math.log((float(Pb) / Nb) / (float(Pa) / Na))
    # if the interval is two-sided then the tail probabilities are cut in half
    pval = (1.0 - CI) / 2 if interval == "two-sided" else (1.0 - CI)
    zval = norm.ppf(1.0 - pval)
    se = math.sqrt((1.0 / Pb) - (1.0 / Nb) + (1.0 / Pa) - (1.0 / Na))
    # return a tuple of (lower_limit, upper_limit)
    return (
        -1.0 if interval == "lower" else math.exp(
            log_lift_mean - zval * se) - 1,
        float("inf") if interval == "upper" else math.exp(
            log_lift_mean + zval * se) - 1
    )
We can use this to find a confidence interval for any level of confidence. The less confident we want to be about the interval, the tighter it will be around 50%.
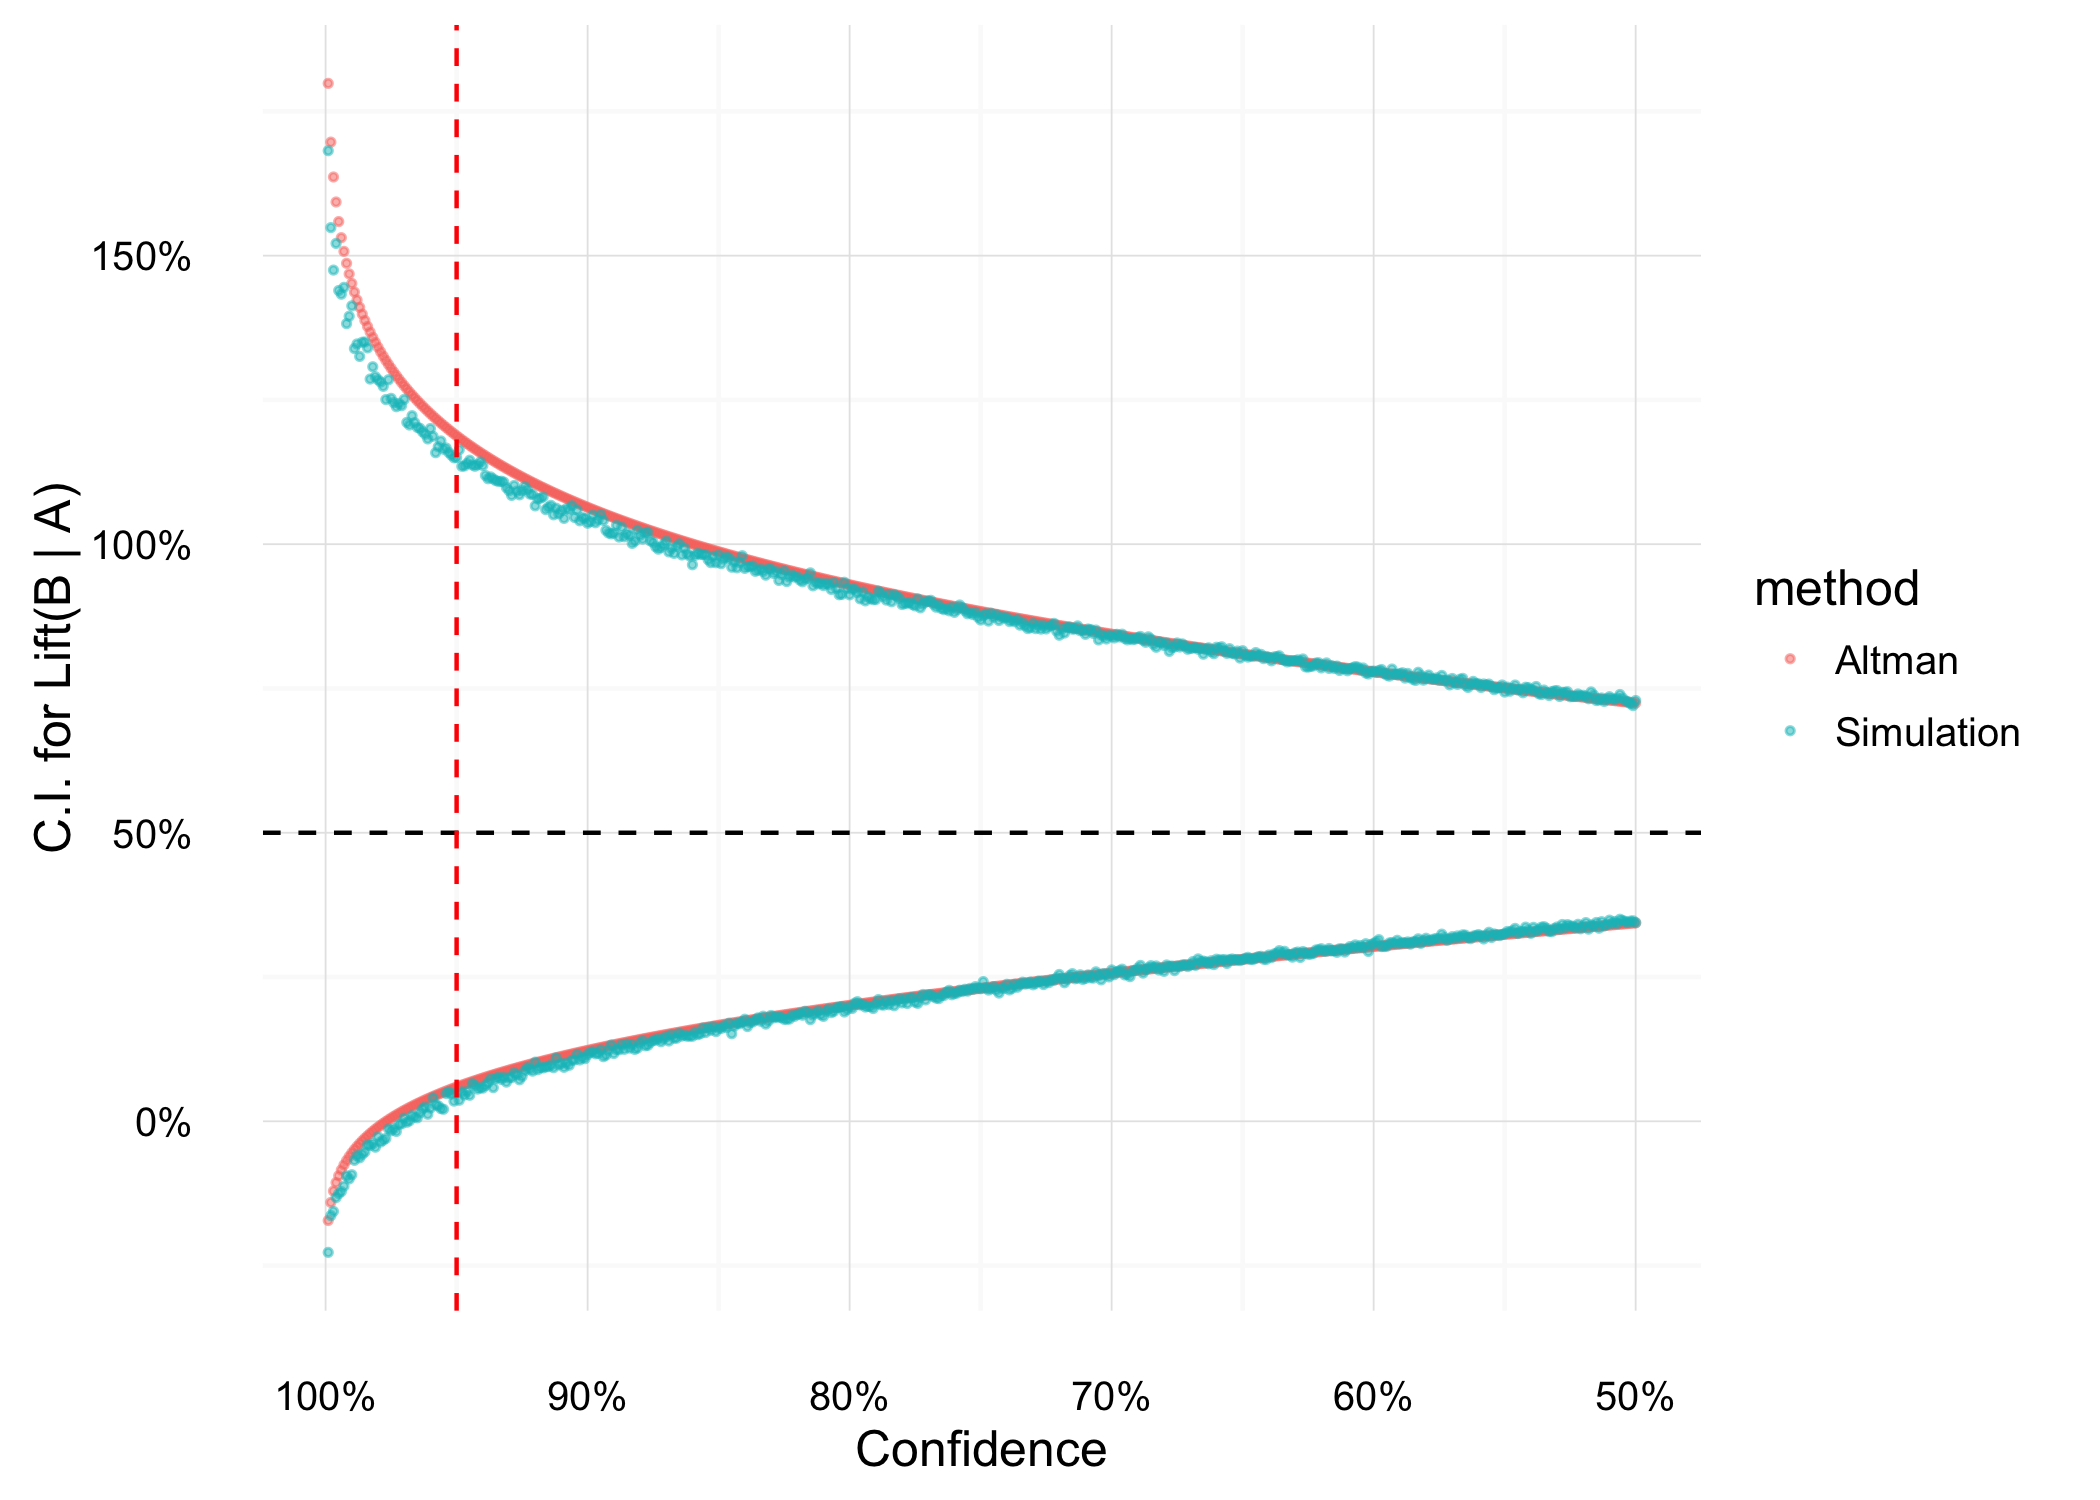 Confidence Intervals using both methods.
And there you have it! At the 95% confidence level (the vertical red dashed line) the interval does not include 0 - we can confidently roll out strategy B, knowing that it will (probably) be better than strategy A.